5 technique brings Data to storytelling
Data working is not easy, especially when decode data to telling in difference ways or create data interesting quite hard because just number may cannot tell all everything. The infographic from data to create story understanding with target must use expertise and understanding about data decoding to describe reading behavior of target.
Storytelling about data in overseas countries called “Data Storytelling” which is science and art of storytelling of data that working on three skill combination are data understanding, data showing and data telling. These skills quite popular in oversea countries and expects data storytelling will important in “everyone must have” level to data telling as well and understand technique to begins creating data to support marketers make data telling easier. Then let’s know 5 techniques of storytelling.
1. Our eyes doesn’t have pattern to sort reading level
Between text reading and graph or data reading was so different. Text reading, mostly eyes will begin from left side to right side or top to bottom but data reading was no sort behavior like text reading. Data reading, eyes will focus on something interested first and step to next details by no sort of reading and it’s hard to make Consumer Journey of reading. So that, the best ways to catch up target’s reading are use colors, big and bold to create type of interesting.
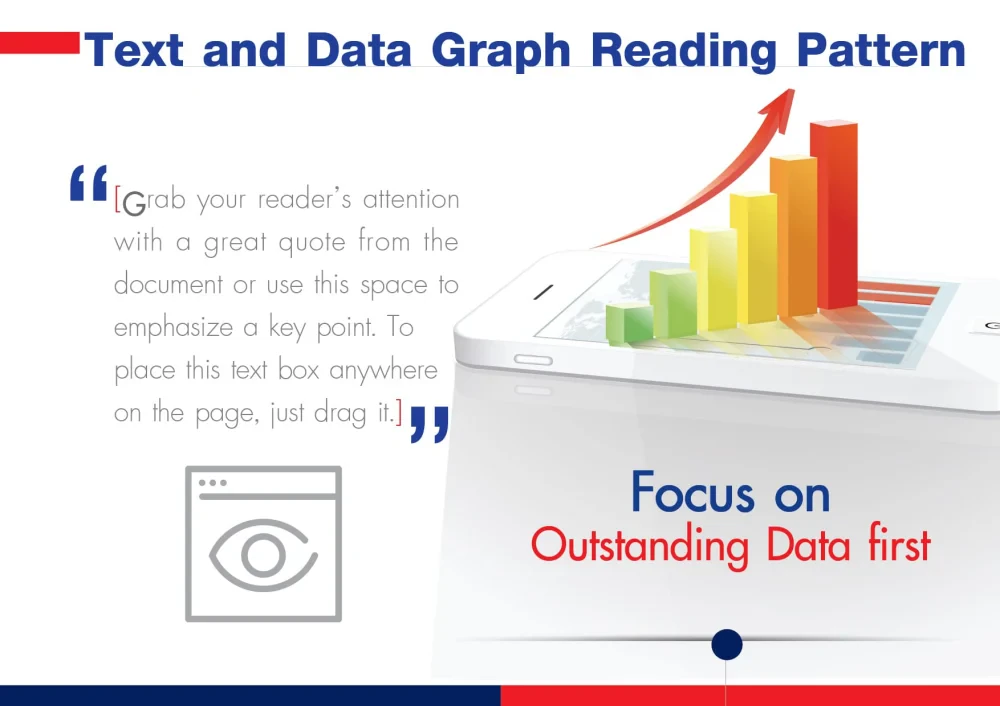
2. Human eyes will focus outstanding things first
In facts, sense of human eyes controlled by brain behavior that finding pattern of different by outstanding from unexceptional. So good data showing, or objective showing should highlight data or make it outstand that will catch target eyes with the data that you want to show and understand the data.
3. Human eyes can less catch in once
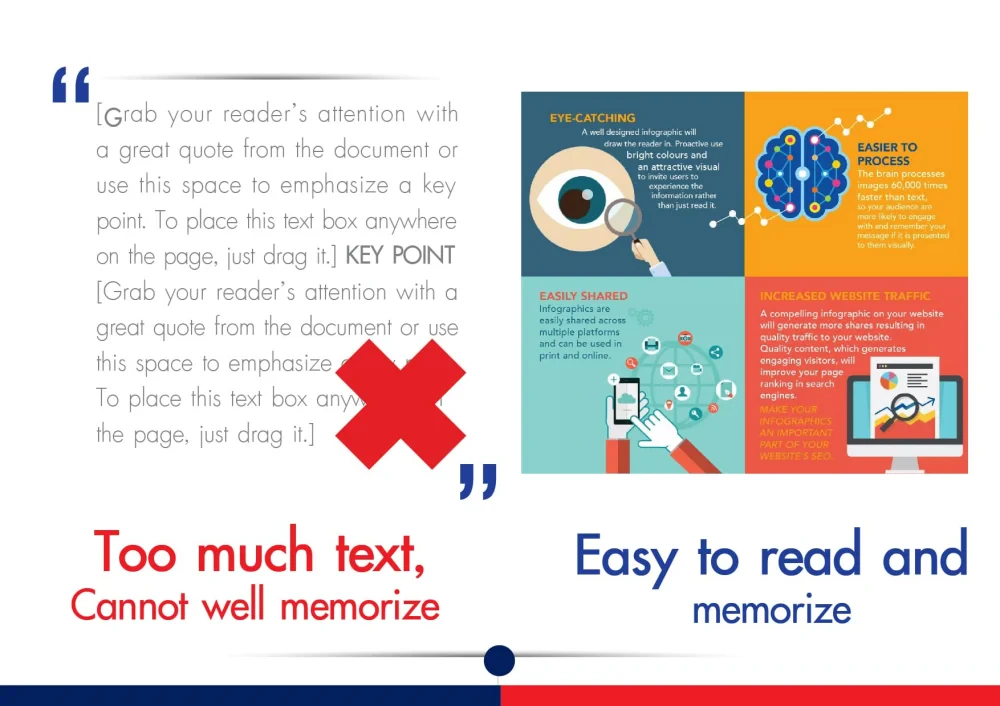
Human brain that direct to eyes doesn’t work on details like camera, but eyes work will receive wide angle without details. That’s why human eyes can receive less details in once. So, many details in one will affect to eyes cannot remember anything special and cannot analysis or confuse the data. Best storytelling should create some picture that easy to understand and put less variable or details of graph for catch key message easier.
4. Human try to decode data
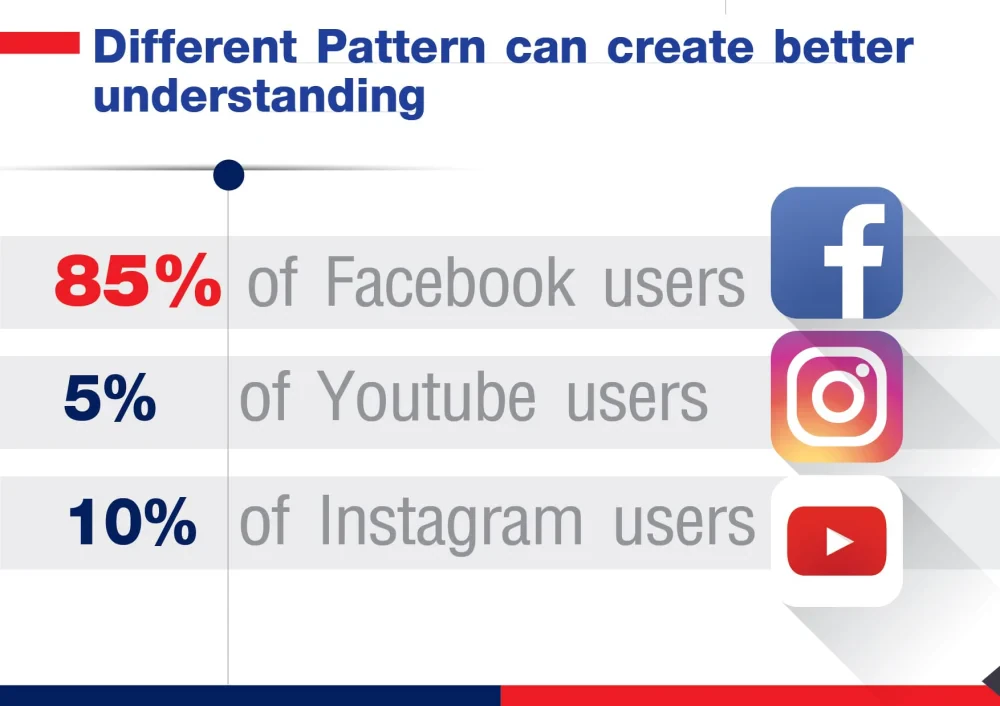
Important thing of brain work is brain was designed for seeing then connect and find the meaning. The eyes will match the data with color immediately. Color matching or data showing is right, readers can see and understand data truly without misunderstanding or confusing the data.
5. Human behavior and their culture
One interesting in one behavior was dominate by culture in their community or socialization. How people interpret the data depends on social culture i.e. normally, people will think “blue is cold, red is hot” or walking from left to right. If you want to tell the story effectively must know reader’s social culture to understand how they express. If communicate in difference ways from their culture or far from familiarity, reader will interpret the data hardly.