
Out-of-home space in APAC presents opportunities for brands to target time-pressed consumers, says GlobalData
Majority of the consumers across the Asia-Pacific (APAC) region prefer to visit out-of-home destinations on a regular basis. As a result, the region presents opportunities for brands to target busier and time-starved consumers, says GlobalData, a leading data and analytics company.
GlobalData’s 2019 Q3 Consumer Survey reveals that 63% of consumers in APAC actively buy products that help them save time and effort.
Shagun Sachdeva, Consumer Insights Analyst at GlobalData, explains: “As consumers spend more time outside the home, they look for products that satisfy their convenience and indulgence, thereby challenging the brands to effectively meet a wide range of occasions and need states, which are constantly in a state of flux, with product and service offerings that can truly meet these consumer needs.”
This is especially visible in the case of meals at foodservice establishments. This can be attributed to convenience and the strong culture in these markets towards eating out at meal times, creating an opportunity for ready-to-eat and grab-and-go offerings.
Sachdeva adds: “Brands seeking to leverage the out-of-home trend must target younger consumers. Out-of-home is in the growth stage of its trend lifecycle. It presents strong growth opportunities across most sectors, including food, alcoholic drinks, non-alcoholic drinks, personal care and foodservice.”
OOH Spending in Thailand by Business Section
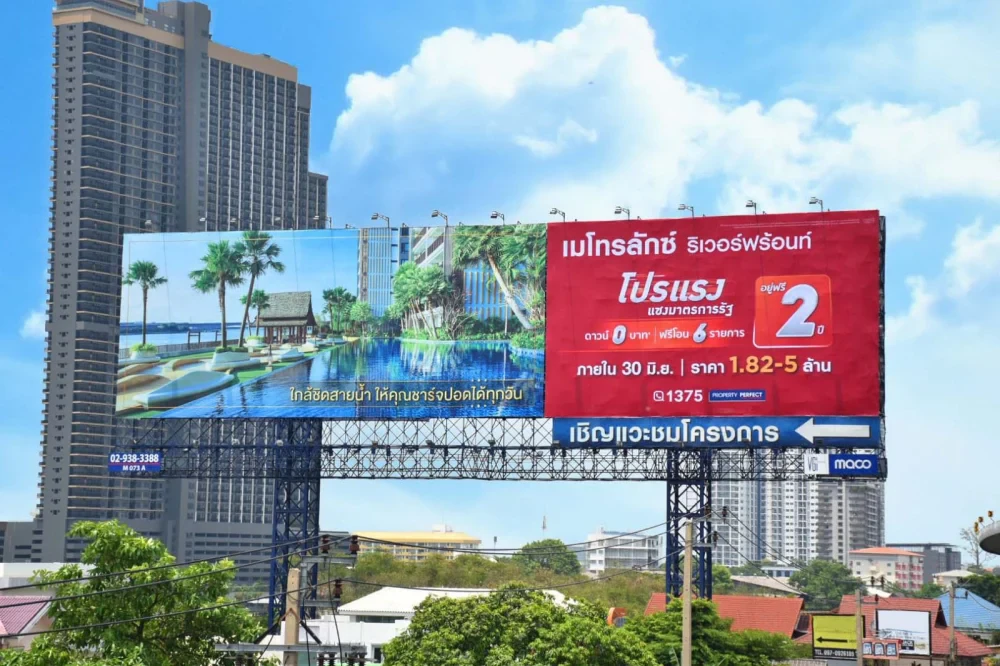
The out-of-home advertising market in Thailand from January to September 2019 was worth THB 9.95 billion. The communications sector recorded the highest spending, followed by real estate and skin-care preparations, respectively.
| Business Section | OOH Ad Spending (THB) |
|---|---|
| 1. Communications | 771,156,000 |
| 2. Real Estate | 746,336,000 |
| 3. Skin-Care Preparations | 700,238,000 |
| 4. Credit/Debit Cards | 376,090,000 |
| 5. Retail Shops/Stores | 360,253,000 |
| 6. Motor Vehicles | 354,692,000 |
| 7. Non-Alcoholic Beverages | 332,590,000 |
| 8. Banks | 251,521,000 |
| 9. Sundries | 242,704,000 |
| 10. Travel & Tours | 238,543,000 |
Highest OOH Advertising Spending in 2019 by Business Section
The brands with the highest OOH advertising spending in each business section were as follows:
| Business Section | Brand | OOH Ad Spending (THB) |
|---|---|---|
| 1. Communications | Samsung Mobile Phone Unit | 205,703,000 |
| 2. Real Estate | AP Condominiums | 39,136,000 |
| 3. Skin-Care Preparations | Estée Lauder Facial Anti-Aging | 84,600,000 |
| 4. Credit/Debit Cards | AEON Credit Cards – Non-Banks | 101,436,000 |
| 5. Retail Shops/Stores | Central Department Store | 71,090,000 |
| 6. Motor Vehicles | Toyota Passenger Cars | 67,797,000 |
| 7. Non-Alcoholic Beverages | Pepsi Soft Drink | 59,986,000 |
| 8. Banks | Bangkok Bank | 57,163,000 |
| 9. Sundries | Siam Laser Clinic (SLC) | 30,590,000 |
| 10. Travel & Tours | AirAsia Airlines | 57,995,000 |
